
Why invest in VIG?
We are the leading insurance group in Central and Eastern Europe. “Protecting what matters” is our promise. More than 50 insurance companies and pension funds provide the best possible protection against the risks of day-to-day life for their customers. The Group strategy is to achieve long-term profitable growth.
2023 Key Figures
EUR
10.9
bn
Insurance service revenue
EUR
772.7
mn
Result before taxes
269
%
Solvency ratio
92.6
%
Net Combined Ratio
5.3
%*
Dividend yield
~
29,000
Employees
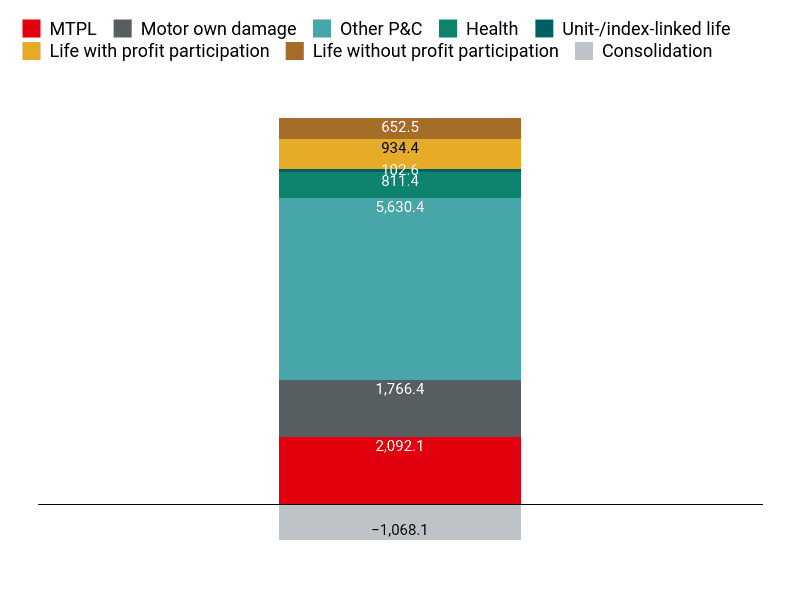
Insurance Service Revenue
by line of business 2023
in EUR mn incl. Group Functions
Investment Story
Broad portfolio with growth potential
- Insurance solutions in the property/casualty, life and health business across 30 countries
- Over 30 years of M&A experience in the CEE region
- Organic and inorganic growth initiatives to further expand VIG's leading market position
Financial stability
- “A+” rating with stable outlook from Standard & Poor’s
- Solvency ratio of 269% in 2023
- Continuous dividend distribution every year since 1994
Proven management principles ensure customer proximity
- Local entrepreneurship for taking quick, flexible action on the market
- Multi-channel distribution to exploit all sales opportunities
- Multi-brand policy to ensure broad appeal in relation to target groups
- Conservative investment and reinsurance policies create trust
Sustainability as an integral part of the business model
- Sustainability program with a focus on six spheres of impact: Investments, underwriting, operations, employees, customers, society
- Declarations of “Responsible Investment” and “Responsible Insurance”
AT0000908504
ISIN
Vienna,Prague,Budapest
LISTINGS
VIG
Ticker symbol
128
mn
ordinary shares
EUR
132.89
mn
share capital
EUR
3.70
bn
MARKET CAPITALISATION (31/03/2024)
 The participation of shareholders in VIG's success is a priority for us, and we have paid dividends every year without interruption since 1994.
Managing Board

Hartwig Löger
General Manager (CEO), Chairman of the Managing Board
CV Download

Peter Höfinger
Deputy General Manager, Deputy Chairman of the Managing Board
CV Download

Liane Hirner
Member of the Managing Board, Chief Finance and Risk Officer (CFRO)
CV Download

Gerhard Lahner
Member of the Managing Board, Chief Operations Officer (COO)
CV Download

Gábor Lehel
Member of the Managing Board, Chief Innovation Officer (CIO)
CV Download

Harald Riener
Member of the Managing Board
CV Download
Key figures table
Key Figures of Vienna Insurance Group
| Income statement |
2023
|
2022 adjusted |
||
|
Calculation differences may arise when rounded amounts and percentages are summed automatically. 1 Gross written premiums are not part of IFRS 17/9 reporting 2 The calculation of this figure considers the interest expenses for hybrid capital. |
||||
| Gross written premiums1 | EUR million | 13,784.0 | 12,559.2 | |
| Insurance service revenue | EUR million | 10,921.8 | 9,737.6 | |
| Total capital investment result | EUR million | 284.3 | -12.2 | |
| Result before taxes | EUR million | 772.7 | 585.7 | |
| Net result of the period after taxes and non-controlling interests | EUR million | 559.0 | 472.3 | |
| Earnings per share2 | EUR | 4.31 | 3.63 | |
| Net Combined Ratio (P&C) | % | 92.6 | 92.8 | |
| Balance sheet | ||||
| Total capital investment portfolio | EUR million | 42,586.1 | 41,062.2 | |
| Insurance contracts liabilities issued | EUR million | 37,804.1 | 36,370.4 | |
| Consolidated shareholders' equity (incl. non-controlling interests) | EUR million | 6,029.7 | 5,713.9 | |
| Contractual Service Margin (CSM) | EUR million | 5,797.2 | 5,838.1 | |
| Total assets | EUR million | 48,753.8 | 47,217.7 | |
| Operating Return on Equity (Operating RoE) | % | 15.1 | 11.6 | |
| Solvency Ratio | % | 269 | 280 | |
IR Calendar
Contact
IR Contact
Investor Relations VIENNA INSURANCE GROUP AG
+43 (0) 50 390 - 21919
Send e-mail
investor.relations@vig.com
Make an appointment
VIG IR on LinkedIn
Related links